https://web.archive.org/web/20090414211107/http://bmrc.berkeley.edu/courseware/cs294/fall97/index.html
[ Back to Assignment ]
The summation is over all pixels. The root mean squared error (RMSE) is the square root of MSE. Some formulations use N rather N^2 in the denominator for MSE.

Typical PSNR values range between 20 and 40. They are usually reported to two decimal points (e.g., 25.47). The actual value is not meaningful, but the comparison between two values for different reconstructed images gives one measure of quality. The MPEG committee used an informal threshold of 0.5 dB PSNR to decide whether to incorporate a coding optimization because they believed that an improvement of that magnitude would be visible.

Image Quality Computation
Signal-to-noise (SNR) measures are estimates of the quality of a reconstructed image compared with an original image. The basic idea is to compute a single number that reflects the quality of the reconstructed image. Reconstructed images with higher metrics are judged better. In fact, traditional SNR measures do not equate with human subjective perception. Several research groups are working on perceptual measures, but for now we will use the signal-to-noise measures because they are easier to compute. Just remember that higher measures do not always mean better quality.
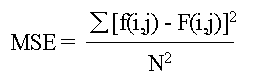
The actual metric we will compute is the peak signal-to-reconstructed image measure which is called PSNR. Assume we are given a source image f(i,j) that contains N by N pixels and a reconstructed image F(i,j) where F is reconstructed by decoding the encoded version of f(i,j). Error metrics are computed on the luminance signal only so the pixel values f(i,j) range between black (0) and white (255).
First you compute the mean squared error (MSE) of the reconstructed image as follows
The summation is over all pixels. The root mean squared error (RMSE) is the square root of MSE. Some formulations use N rather N^2 in the denominator for MSE.
PSNR in decibels (dB) is computed by using
Typical PSNR values range between 20 and 40. They are usually reported to two decimal points (e.g., 25.47). The actual value is not meaningful, but the comparison between two values for different reconstructed images gives one measure of quality. The MPEG committee used an informal threshold of 0.5 dB PSNR to decide whether to incorporate a coding optimization because they believed that an improvement of that magnitude would be visible.
Some definitions of PSNR use 2552/MSE rather than 255/RMSE. Either formulation will work because we are interested in the relative comparison, not the absolute values. For our assignments we will use the definition given above.
The other important technique for displaying errors is to construct an error image which shows the pixel-by-pixel errors. The simplest computation of this image is to create an image by taking the difference between the reconstructed and original pixels. These images are hard to see because zero difference is black and most errors are small numbers which are shades of black. The typical construction of the error image multiples the difference by a constant to increase the visible difference and translates the entire image to a gray level. The computation is
You can adjust the constant (2) or the translation (128) to change the image. Some people use white (255) to signify no error and difference from white as an error which means that darker pixels are bigger errors.
References
A.N. Netravali and B.G. Haskell, Digital Pictures: Representation, Compression, and Standards (2nd Ed), Plenum Press, New York, NY (1995).
M. Rabbani and P.W. Jones, Digital Image Compression Techniques, Vol TT7, SPIE Optical Engineering Press, Bellevue, Washington (1991).
No comments:
Post a Comment
Note: Only a member of this blog may post a comment.