Dev Environment
- All code written and tested on Linux - Not a port
- Distros we're developing on: Kubuntu 13.10, Ubuntu 12.04, Linux Mint
- IDE: QtCreator v3.0.0
- Building: cmake+ninja
- Compiler: clang v3.3
- gcc v4.6 works too, but is very slow
- chroots used to standardize our build environment across dev machines
- Source control: Mercurial, TortoiseHG
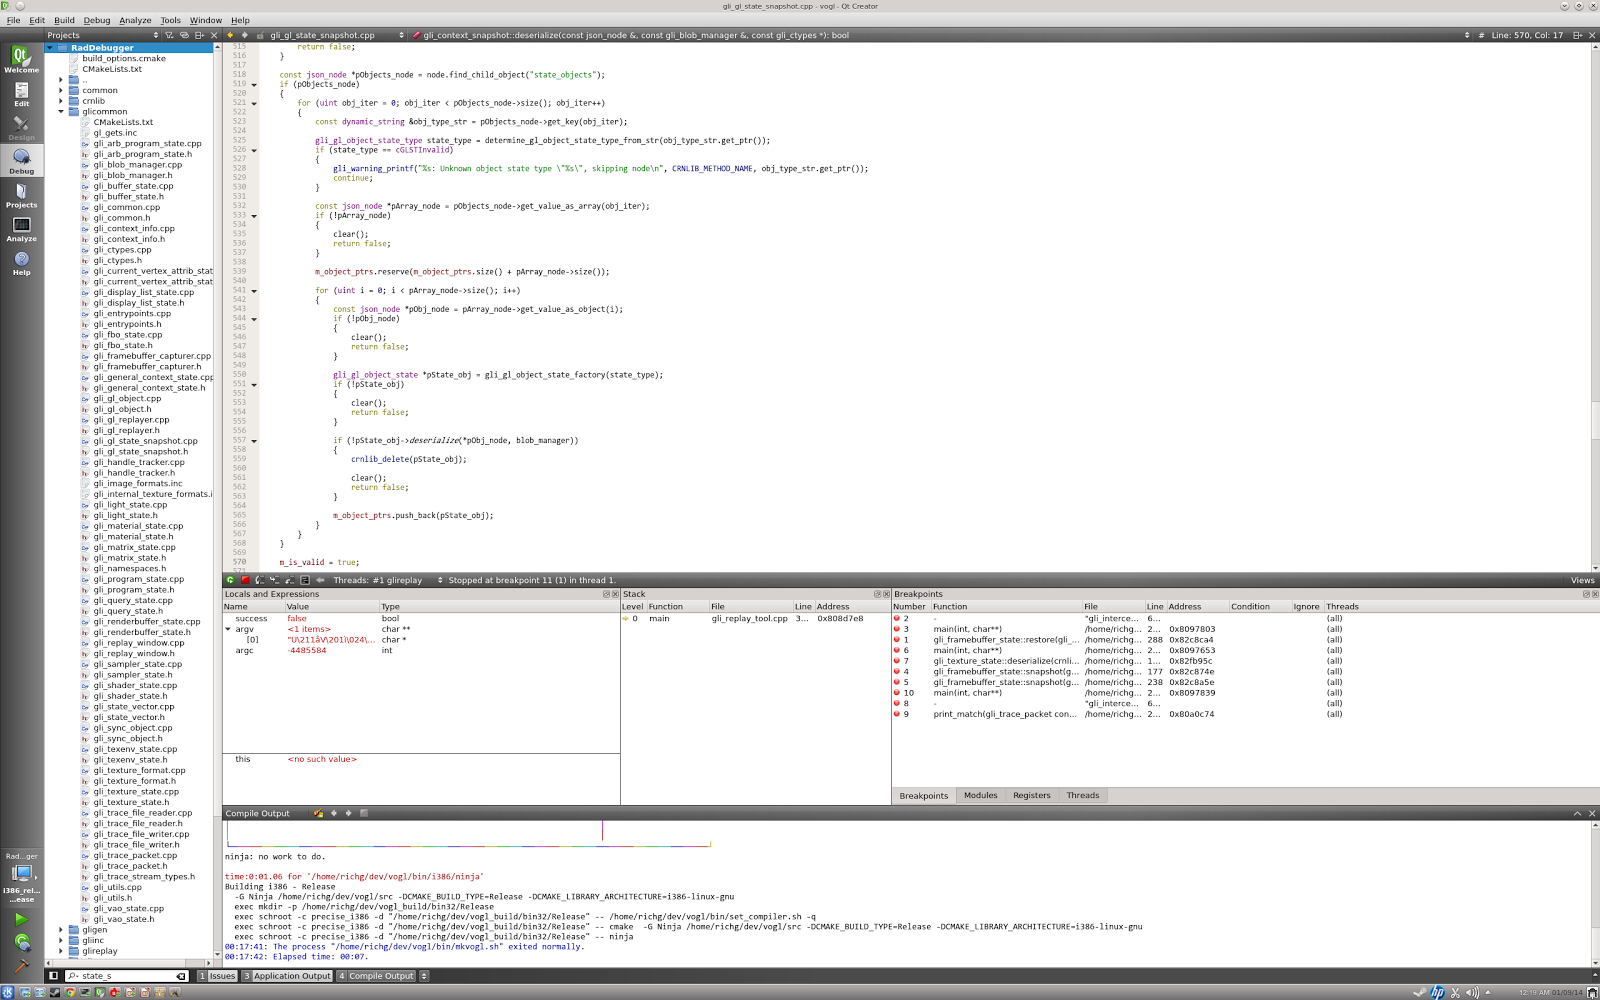
QtCreator v3.0.0: IDE, gdb debugger front-end, integrated source control:
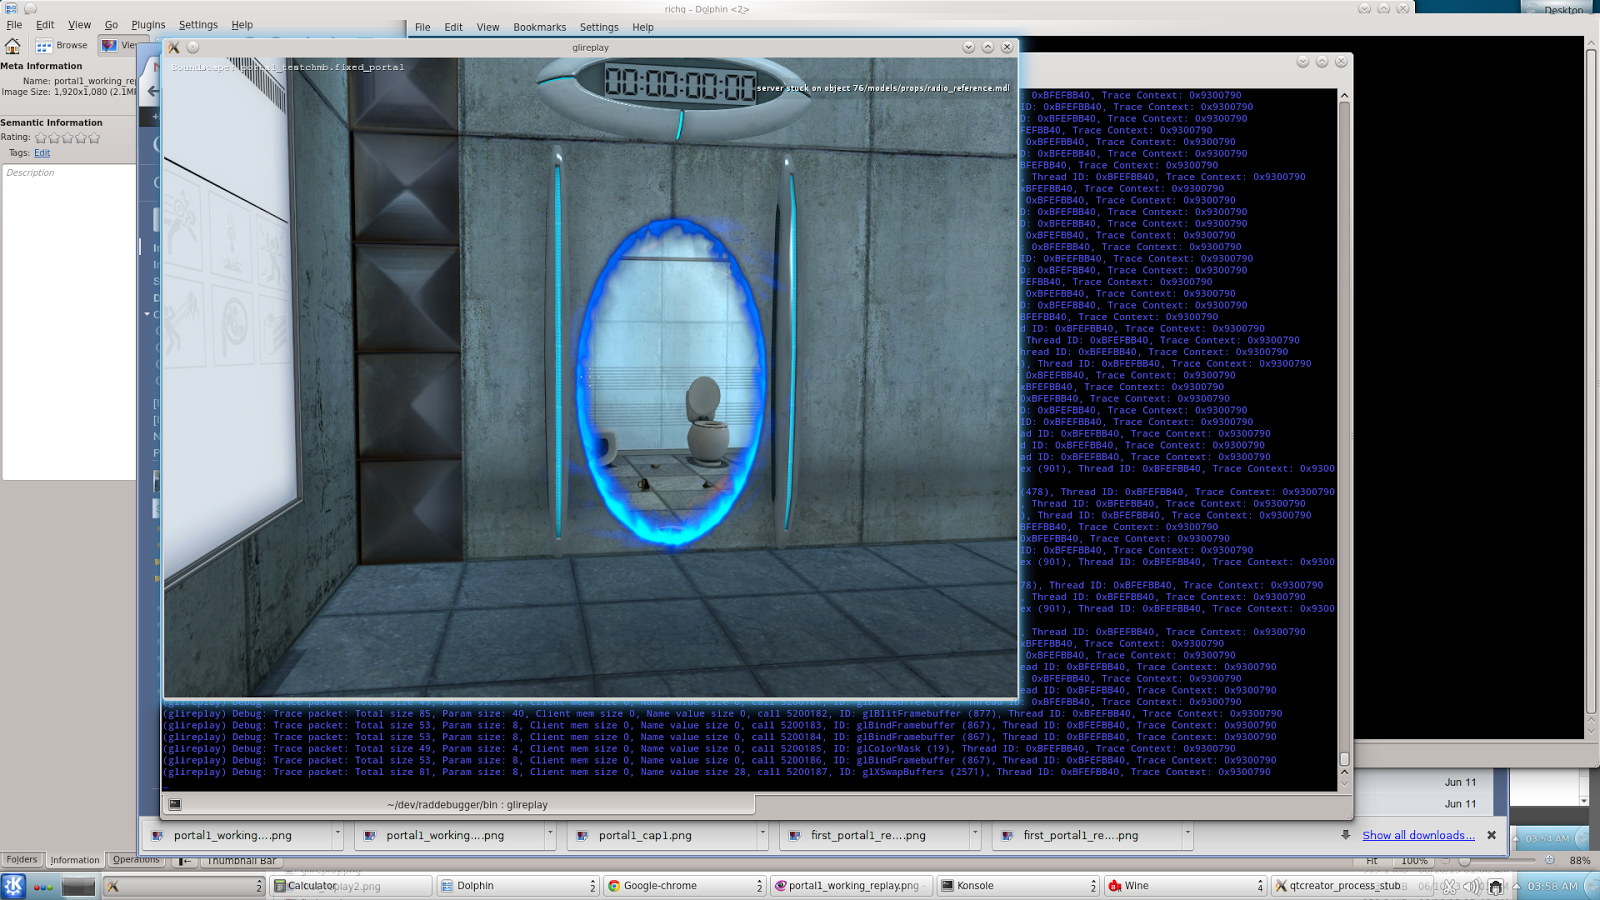
First Non-Divergent Replay: Portal
- 5.4 megacalls, 1.9 GB trace file
VOGL's Current GL Compatibility
- GL v1 - v3.3, core or compatibility contexts, partial support for GL v4.x (full 4.x later this year)
- Tracer: 2,652 functions, almost all auto-genned. Replayable: 1,498 functions, ~45% auto-genned
- Fully supported extensions:
- AMD_draw_buffers_blend, ARB_blend_func_extended, ARB_color_buffer_float, ARB_copy_buffer, ARB_create_context, ARB_debug_output, ARB_draw_buffers, ARB_draw_buffers_blend, ARB_draw_elements_base_vertex, ARB_framebuffer_object, ARB_get_proc_address, ARB_get_program_binary, ARB_gpu_shader_fp64, ARB_instanced_arrays, ARB_internalformat_query, ARB_internalformat_query2, ARB_map_buffer_range, ARB_multisample, ARB_multitexture, ARB_occlusion_query, ARB_point_parameters, ARB_program_interface_query, ARB_provoking_vertex, ARB_sample_shading, ARB_shader_atomic_counters, ARB_shader_objects, ARB_sync, ARB_texture_buffer_object, ARB_texture_compression, ARB_texture_multisample, ARB_texture_storage, ARB_texture_storage_multisample, ARB_timer_query, ARB_transpose_matrix, ARB_uniform_buffer_object, ARB_vertex_array_object, ARB_vertex_buffer_object, ARB_vertex_program, ARB_vertex_shader, ARB_vertex_type_2_10_10_10_rev, ARB_viewport_array, ARB_window_pos, EXT_bindable_uniform, EXT_blend_color, EXT_blend_equation_separate, EXT_blend_func_separate, EXT_blend_minmax, EXT_compiled_vertex_array, EXT_cull_vertex, EXT_depth_bounds_test, EXT_draw_buffers2, EXT_draw_instanced, EXT_draw_range_elements, EXT_fog_coord, EXT_framebuffer_blit, EXT_framebuffer_multisample, EXT_framebuffer_object, EXT_geometry_shader4, EXT_gpu_program_parameters, EXT_gpu_shader4, EXT_multi_draw_arrays, EXT_multisample, EXT_paletted_texture, EXT_point_parameters, EXT_polygon_offset, EXT_provoking_vertex, EXT_secondary_color, EXT_stencil_two_side, EXT_subtexture, EXT_swap_control, EXT_texture3D, EXT_texture_buffer_object, EXT_texture_integer, EXT_texture_object, EXT_timer_query, GREMEDY_frame_terminator, GREMEDY_string_marker, NV_vertex_program4, SGI_swap_control
- Partial support for many more extensions, prioritized by usage and importance. ARB/EXT higher priority vs. vendor specific.
- sharelist support
- Replayer class is currently single threaded and automatically issues MakeCurrent()’s as needed.
- Trace packets have timestamps and a global call counter, replayer issues them in “wall clock” time order.
- Lots of support for old-school GL API’s:
- ARB assembly language shaders (ARB_vertex_program and ARB_pixel_program)
- Client side arrays (CSA’s):
- Set via glVertexAttribPointer, glNormalPointer, glTexCoordPointer, glInterleavedArrays, etc.
- glBegin/glEnd
- Display lists:
- Currently only support the most popular usages: whitelist of ~500 funcs, non-recursive, only texture binding
- Fixed function pipeline:
- Lights, texgen, texenv, materials, lights, matrix stacks, etc.
Completed and Short-Term Goals
- Completed goals:
- Survey all existing solutions, determine strengths/weaknesses of each.
- Build database of all known GL API’s. No single definitive source found - so we combine:
- Old Khronos .spec, apitrace's glapi.py, and Fournier's "gl-spec-parser" web scraper.
- New Khronos XML spec not used yet - wasn’t available at the time.
- Create 32/64-bit tracer SO and replayer tool based off a common set of reusable C++ classes
- Replayer class accepts arbitrary packets from any source (even generated on the fly)
- State snapshot/restore classes for generating GL state snapshots and restoring them
- Snapshot classes just make standard GL calls, no knowledge of tracing or replaying
- Any GL state that needs shadowing is handled by the tracer or replayer itself
- All state objects serializable/deserializable to JSON/UBJ+binary files
- Test tools on a variety of real and synthetic call streams, get as many apps to work as possible, iterate
- Current goals:
- Finish GL 3.x support before moving to 4.x - only a handful of GL 3.x state to snapshot/restore remaining at this point
- Trace editor UI - needs a lot of love
- Build library of app traces, implement continuous automated regression testing
- Profile and optimize GL replayer class, build driver benchmarking tool
- We’re already ~90% faster than apitrace’s replayer in -benchmark mode on Metro Last Light
Longer Term Goals
- Trace editor/debugger UI
- Full control over server: Click button to launch app on Steambox, another to capture frame, etc.
- Full display of GL state vector, state vector diff’ing between two calls
- Obvious things: Live editing, vertex/pixel history, CPU and GPU profiling, etc.
- On the fly tracing
- Tracer records state snapshots every X seconds, also continuously records ring buffer of GL trace packets
- User clicks to save trace containing previous X seconds of gameplay to new trace file
- Faster looping and seeking through huge traces (“DVR” replayer mode)
- Lazy program shader compilation and linking during state restore/playback
- Automatic keyframe generation during tracing or playback - use worker thread to write snapshots
- Generate delta state snapshot objects, for fast seeking between keyframes/faster frame looping
- Replayer perf: Fully multithreaded playback pipeline
- For each context: thread A decodes packets and composes x86 opcodes to call GL, thread B execs this
- Really long term: Vendor neutral shader debugging using standard GL calls
- Compile shader to AST, insert atomic append ops that dump shader IP+variable state after each op to a huge buffer (only on selected vertex/pixel), output AST as GLSL, run draw with this shader
- UI reads and parses buffer, now we have all the info we need to simulate shader stepping in a UI
- Easier said than done, but we believe it’s inevitable that someone is going to do this right.
JSON Support Details
- Binary traces convertible to JSON traces and vice versa
- Binary traces are dumped to: one JSON file per frame, loose files for large data blobs contained in trace packets, and the trace’s .zip archive.
- JSON traces guaranteed lossless vs. binary: float/double’s coded as hex strings when needed.
- .zip archive can be unzipped and deleted, trace is still replayable from loose files, and loose files take precedence over archive files.
- Direct playback and debugging of JSON traces
- JSON traces and blob files designed to be manually editable
- Replayer does its best to fix up/adjust GL call parameters as needed.
- Many fields optional, and we’ve tried to avoid “magic” keys or field interdependencies.
- Binary traces also make extensive use the Universal Binary JSON (UBJ) format: http://ubjson.org/
- The voglcommon lib contains helper classes to read/write traces and packets, or you can read the JSON data yourself.
References
- John McDonald’s gfxtrace - Experimental tracer for TF2 GL (Windows only):
- apitrace - Full-stream tracer, replayer, UI trace viewer/debugger:
- apitrace's glapi.py - High quality GL API definition, contains key parameter namespace and array size information:
- Old Khronos GL/GLX .spec files - No longer updated, has many bugs/missing parameters:
- Official Khronos XML spec files - Latest spec:
- Alexandre Fournier's "gl-spec-parser" Python script - scrapes the Khronos reference, extension, and enumerates pages to XML:
- Piglit driver testing framework:
- Universal Binary JSON (UBJ) format:
Greetings Rich,
ReplyDeleteSince you are very keen on Clang and QtCreator, do you have then work together? I mean there was some branch of QtCreator integrating Clang support ( code completion, etc.) but it is not merged. Thanks.
It's merged now, pass LLVM_INSTALL_DIR to qmake when building from source, here you can find the script for Arch Linux which will build Qt Creator with Clang parser for you: http://lset.tumblr.com/
DeleteHow could I missed that. I am not in a hurry and will wait for the official release, but that is awesome!
DeleteDoes VOGL act as middle-man to the OpenGL driver like APITrace or does it need some level of access to the C/C++ source being debugged?
ReplyDeleteDuplicating questions here, just in case.
ReplyDeleteWhat plans Valve have on this thing? Proprietary distribution like the AMD's gDEBugger?
I'm working on open-source reincarnation of glslDevil: https://github.com/SirAnthony/GLSL-Debugger, actually integrating mesa gl compiller into it for GLSL 4.x support in shader debugging. May be you will be interested.
We're going completely open source - GL is just too large of an API (and changing too quickly) for a small team to keep up. We'll be putting it up on bitbucket (or maybe github - we haven't decided for sure yet). We'll accept patches, bug reports, game traces, etc. We want to enable everyone that we can to make better GL games and drivers. We're planning on having the UI fleshed out enough to view all major GL state by GDC. Two major driver vendors have already expressed interest in helping us out which is wonderful.
ReplyDeletevogl's tracer is just like apitrace's tracer: you can LD_PRELOAD it into your process (or manually load it like you would libgl.so) and it intercepts all of your GL/GLX calls. It's as transparent as we could make it: we shadow key bits, and optionally serialize what you do and pass along all calls into the driver. Occasionally, we have to make some extra hidden GL calls to retrieve linked program metadata, peek at GL errors, etc. or do glGet's while taking a snapshot. This activity should not be visible to your app. We are very careful about not injecting GL errors into your app while making hidden calls. We occasionally must modify your params during tracing, for example write-only mapped buffers are set as readable/writable when we call GL so we can read the exact contents of buffers when we serialize them.
If you use multiple contexts, we require that you don't leave your secondary contexts current on any threads when you call glXSwapBuffer()'s, because our snapshot code needs to make them current on the thread that calls glXSwapBuffer()'s in order to query their state. Also, we have some constraints on handle usage related to multiple contexts/different threads that we'll document. (These constraints should not impact the vast majority of GL apps in practice.) Shadowing GL handles, especially across multiple contexts in all possible (but technically valid) GL scenarios is very tricky.
We use two chroot's for cleanly building 32-bit and 64-bit. We don't use qmake, but cmake for building everything. It took us a while, but we figured out how to cleanly configure QtCreator so we can build the project via cmake from within chroots -- all nicely within QtCreator itself. We also figured out how to use QtCreator's ninja compiler warning/error parser to work when we use ninja to build (you need to redirect both stdout/stderr to just stdout, or maybe just stderr - I don't remember offhand how Mike did it exactly). Mike Sartain or I will write a full description of how we've deeply integrated cmake+ninja into QtCreator (just by configuring it properly within a couple days.
For clang, Mike Sartain figured out how to switch between gcc vs. clang in a way that was compatible with an "out of the box" install of QtCreator:
http://linux-debugger-bits.blogspot.com/2013/07/clang-33-with-64-bit-ubuntu-1204.html
We first did this outside of chroots to build with clang. Now we do it within the 32-bit/64-bit chroot's. Works really well. Also, we've had no issues debugging clang built apps with QtCreator 2.8.x or 3.0.0.
> Mike Sartain or I will write a full description of how we've deeply integrated cmake+ninja into QtCreator
DeleteThat would be sooo great!
That's sounding a little complicated. Will I be able to just download the source code, type "cmake," and get it to compile?
Delete>We're going completely open source
DeleteSounds great. If you will do good interface for shader debugging entry points, I can port pieces of my code which implements your 'Really long term' and already working.
Will it work with JOGL, I.e. Java OpenGL programs?
Deletebadass!
ReplyDeleteDont forget about webgl and egl/gles support too!
I'm wondering what is the reasoning behind the decision to create a new debugger from scratch rather than improving apitrace. From the description they both seem similar.
ReplyDeleteapitrace supports full-stream tracing only, which is fine for small GL apps but is less than optimal when trying to debug large GL games that can take 60-90 secs to load with additional time (dozens of secs up to several minutes) needed to get a repro case to show up. Playing back these large traces, sometimes dozens (even hundreds) of times, to narrow down bugs is not enjoyable or productive at all. There's a trim command in there but I gave up trying to use it after trying to trim a small TF2 trace and letting it go overnight (!).
DeleteAround a year ago Peter Lohrmann (working for Valve) actually spent several months modifying apitrace to do the things we need to effectively debug big GL apps: restorable state snapshots, single/multi-frame capturing while tracing or replaying, and efficient/usable trace trimming. His patches are out there, but I believe they were only tested on Source1 GL apps. This first attempt taught us a lot about the problem domain. Also, at the time apitrace was not able to reliably replay Source1 GL apps such as L4D2 without randomly diverging. Peter fixed these problems.
So after studying apitrace for quite a bit, and contributing back some fixes/patches, we realized the real problem we needed to solve (restorable state snapshotting) wasn't the focus of apitrace's architecture. So we didn't have a lot to loose by dumping it and starting from scratch. Also, apitrace's usage of Python scripts to auto-gen massive amounts of C/C++ code was a real turn-off, and we didn't care about D3D or ES debugging. In hindsight, I think we made the right decision because we've spent far more dev time on the state snapshot/restore problem than tracing.
Will your debugger support 'attach to running process' feature? It is very usable for big apps you talking about.
DeleteWith a name like that, it's going to have a bird for the logo, right?
ReplyDeleteHi Rich,
ReplyDeleteWe on Mozilla Gfx team are really interested in using VOGL to help us debug our OGL usage. Do you guys have an estimate and when VOGL might be released, so we can start hacking on it?
thanks
- Dan
Hi Rich, will you be there at GDC in San-Francisco this year? I'm interested in VOGL stuff a lot.
ReplyDeleteThis comment has been removed by a blog administrator.
ReplyDeleteThis comment has been removed by a blog administrator.
ReplyDeleteThis comment has been removed by a blog administrator.
ReplyDelete